LLM Monitoring (Beta)
Sentry LLM Monitoring offers organizations rich debugging context, and visibility into the cost and performance of applications calling LLMs. Developers get better visibility into their LLM-powered applications with automatic token cost and usage calculations for their LLMs. Developers can identify the root cause of an issue fast with detailed debugging context, like the model version, user prompts, and the sequence of calls to the LLM. With real-time visibility into errors, performance bottlenecks and cost, organizations can make their LLM-powered applications more effective and efficient.

Sentry LLM Monitoring is for you if:
- You want to understand the costs of your LLMs in production, and set alerts on cost overruns.
- It's currently difficult to debug issues with your LLMs, especially subjective failures like bad responses.
- You want to understand the performance of LLMs in the context of other operations like database calls and HTTP servers.
Core Features
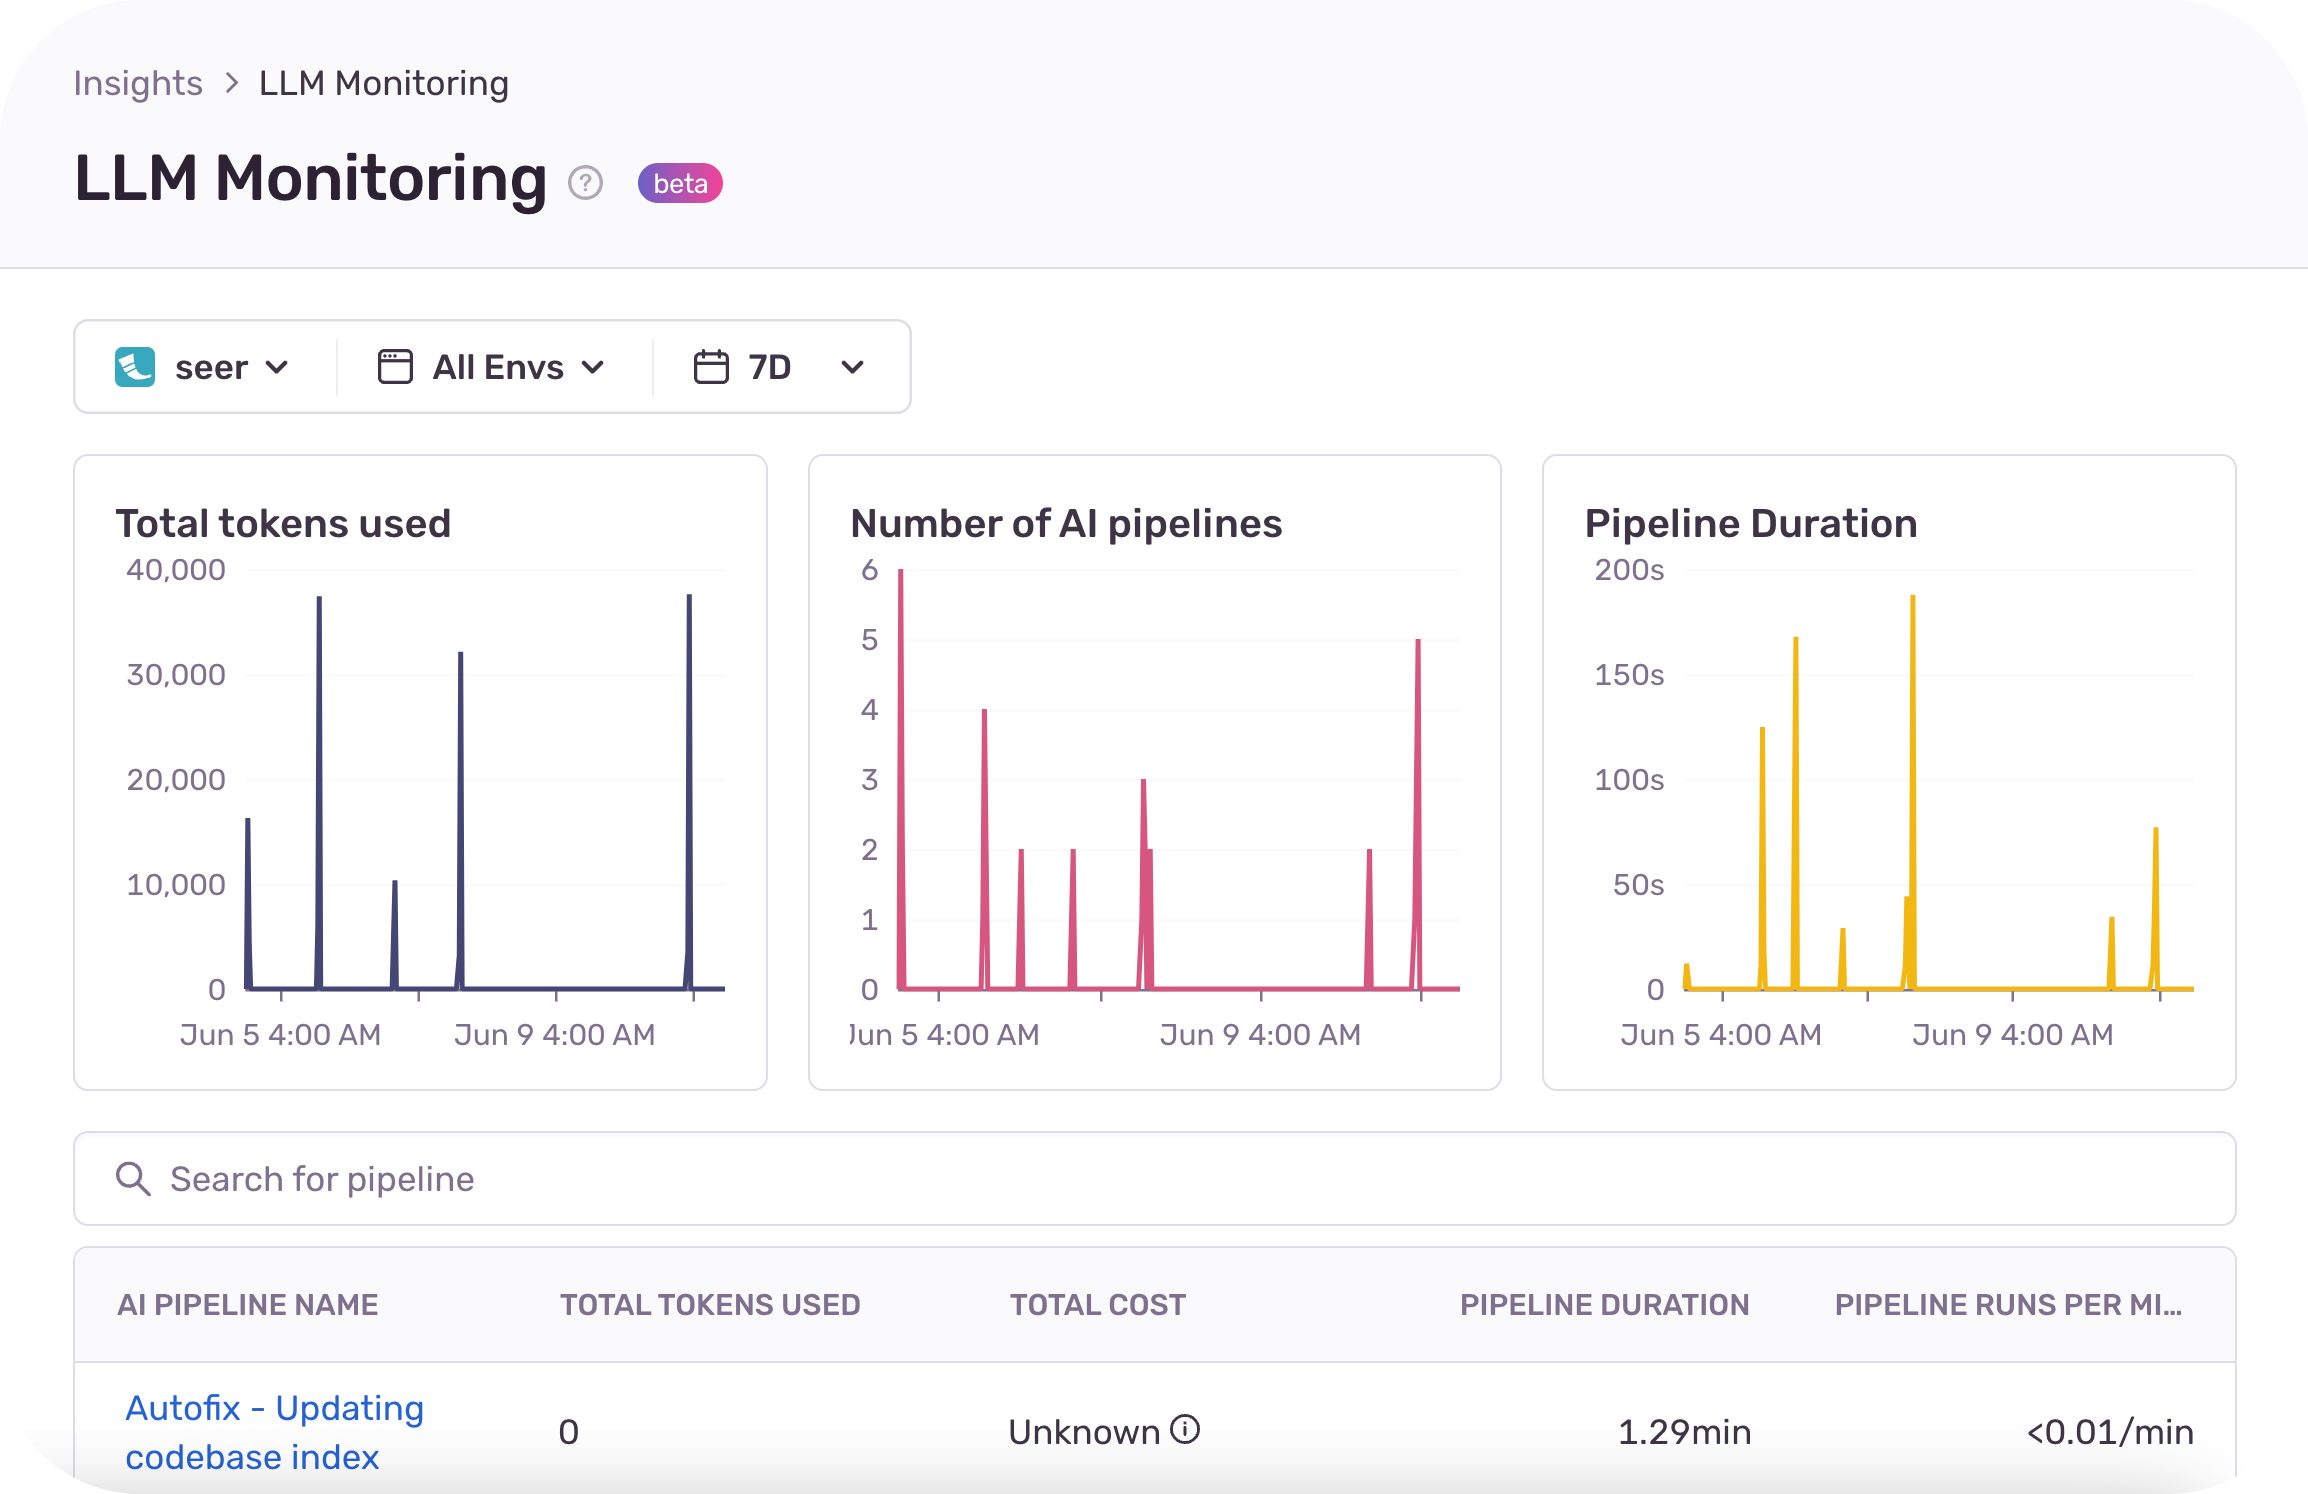
- Tracking token usage and cost across multiple LLM models in real-time.
- Alerting on token usage and cost.
- Detailed debugging context like the model version, prompt and the sequence calls made to the LLM.
- Visibility of token usage, cost and performance by AI pipeline.
Getting started
Sentry LLM Monitoring is automatically enabled for users of the Sentry Python SDK. You can also use our provided decorators to manually create AI pipelines and store token usage information. 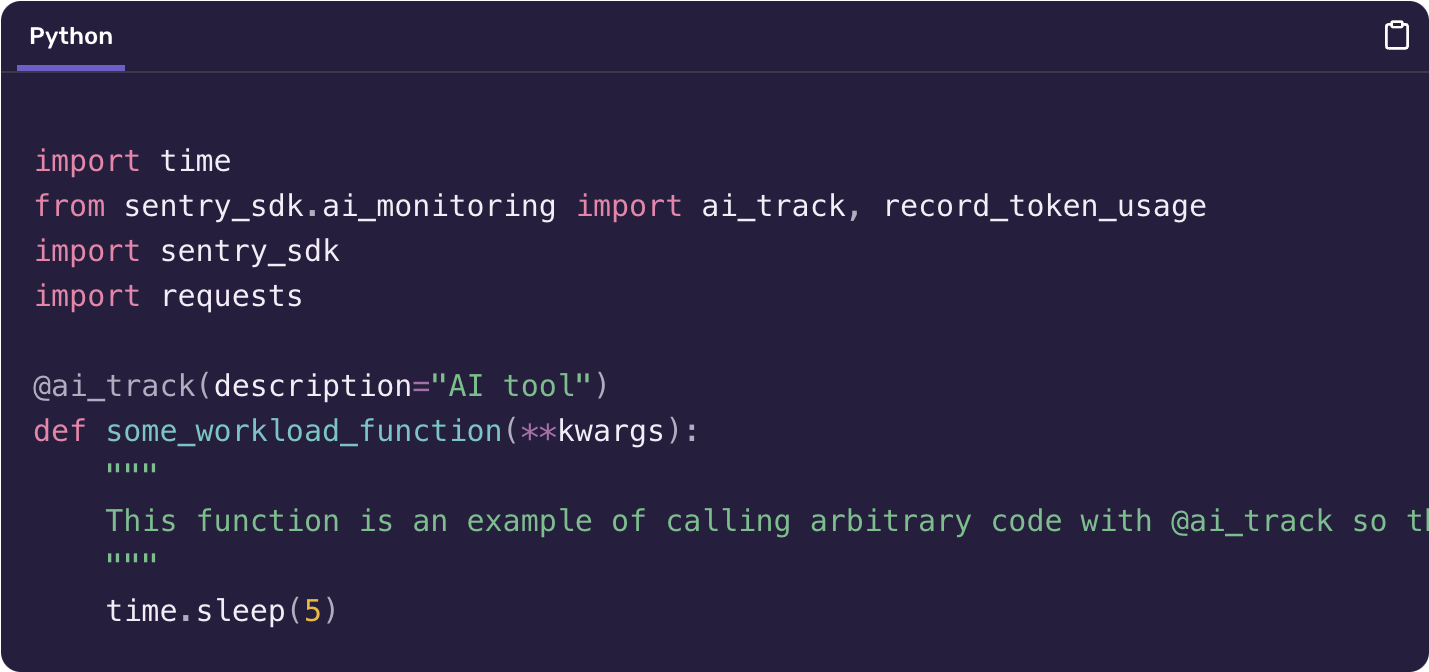
You'll need:
- LangChain, or a Python function instrumented with
@ai_trackthat calls one or more LLMs. - One of the official Python packages for OpenAI, Anthropic, Huggingface Hub, or Cohere, or explicit token usage measurements with the record_token_usage function.